 See photos and updates from listings directly in your feed
 Share your favorite listings with friends and family
 Save your search and get new listings directly in your mailbox before everybody else
Summary
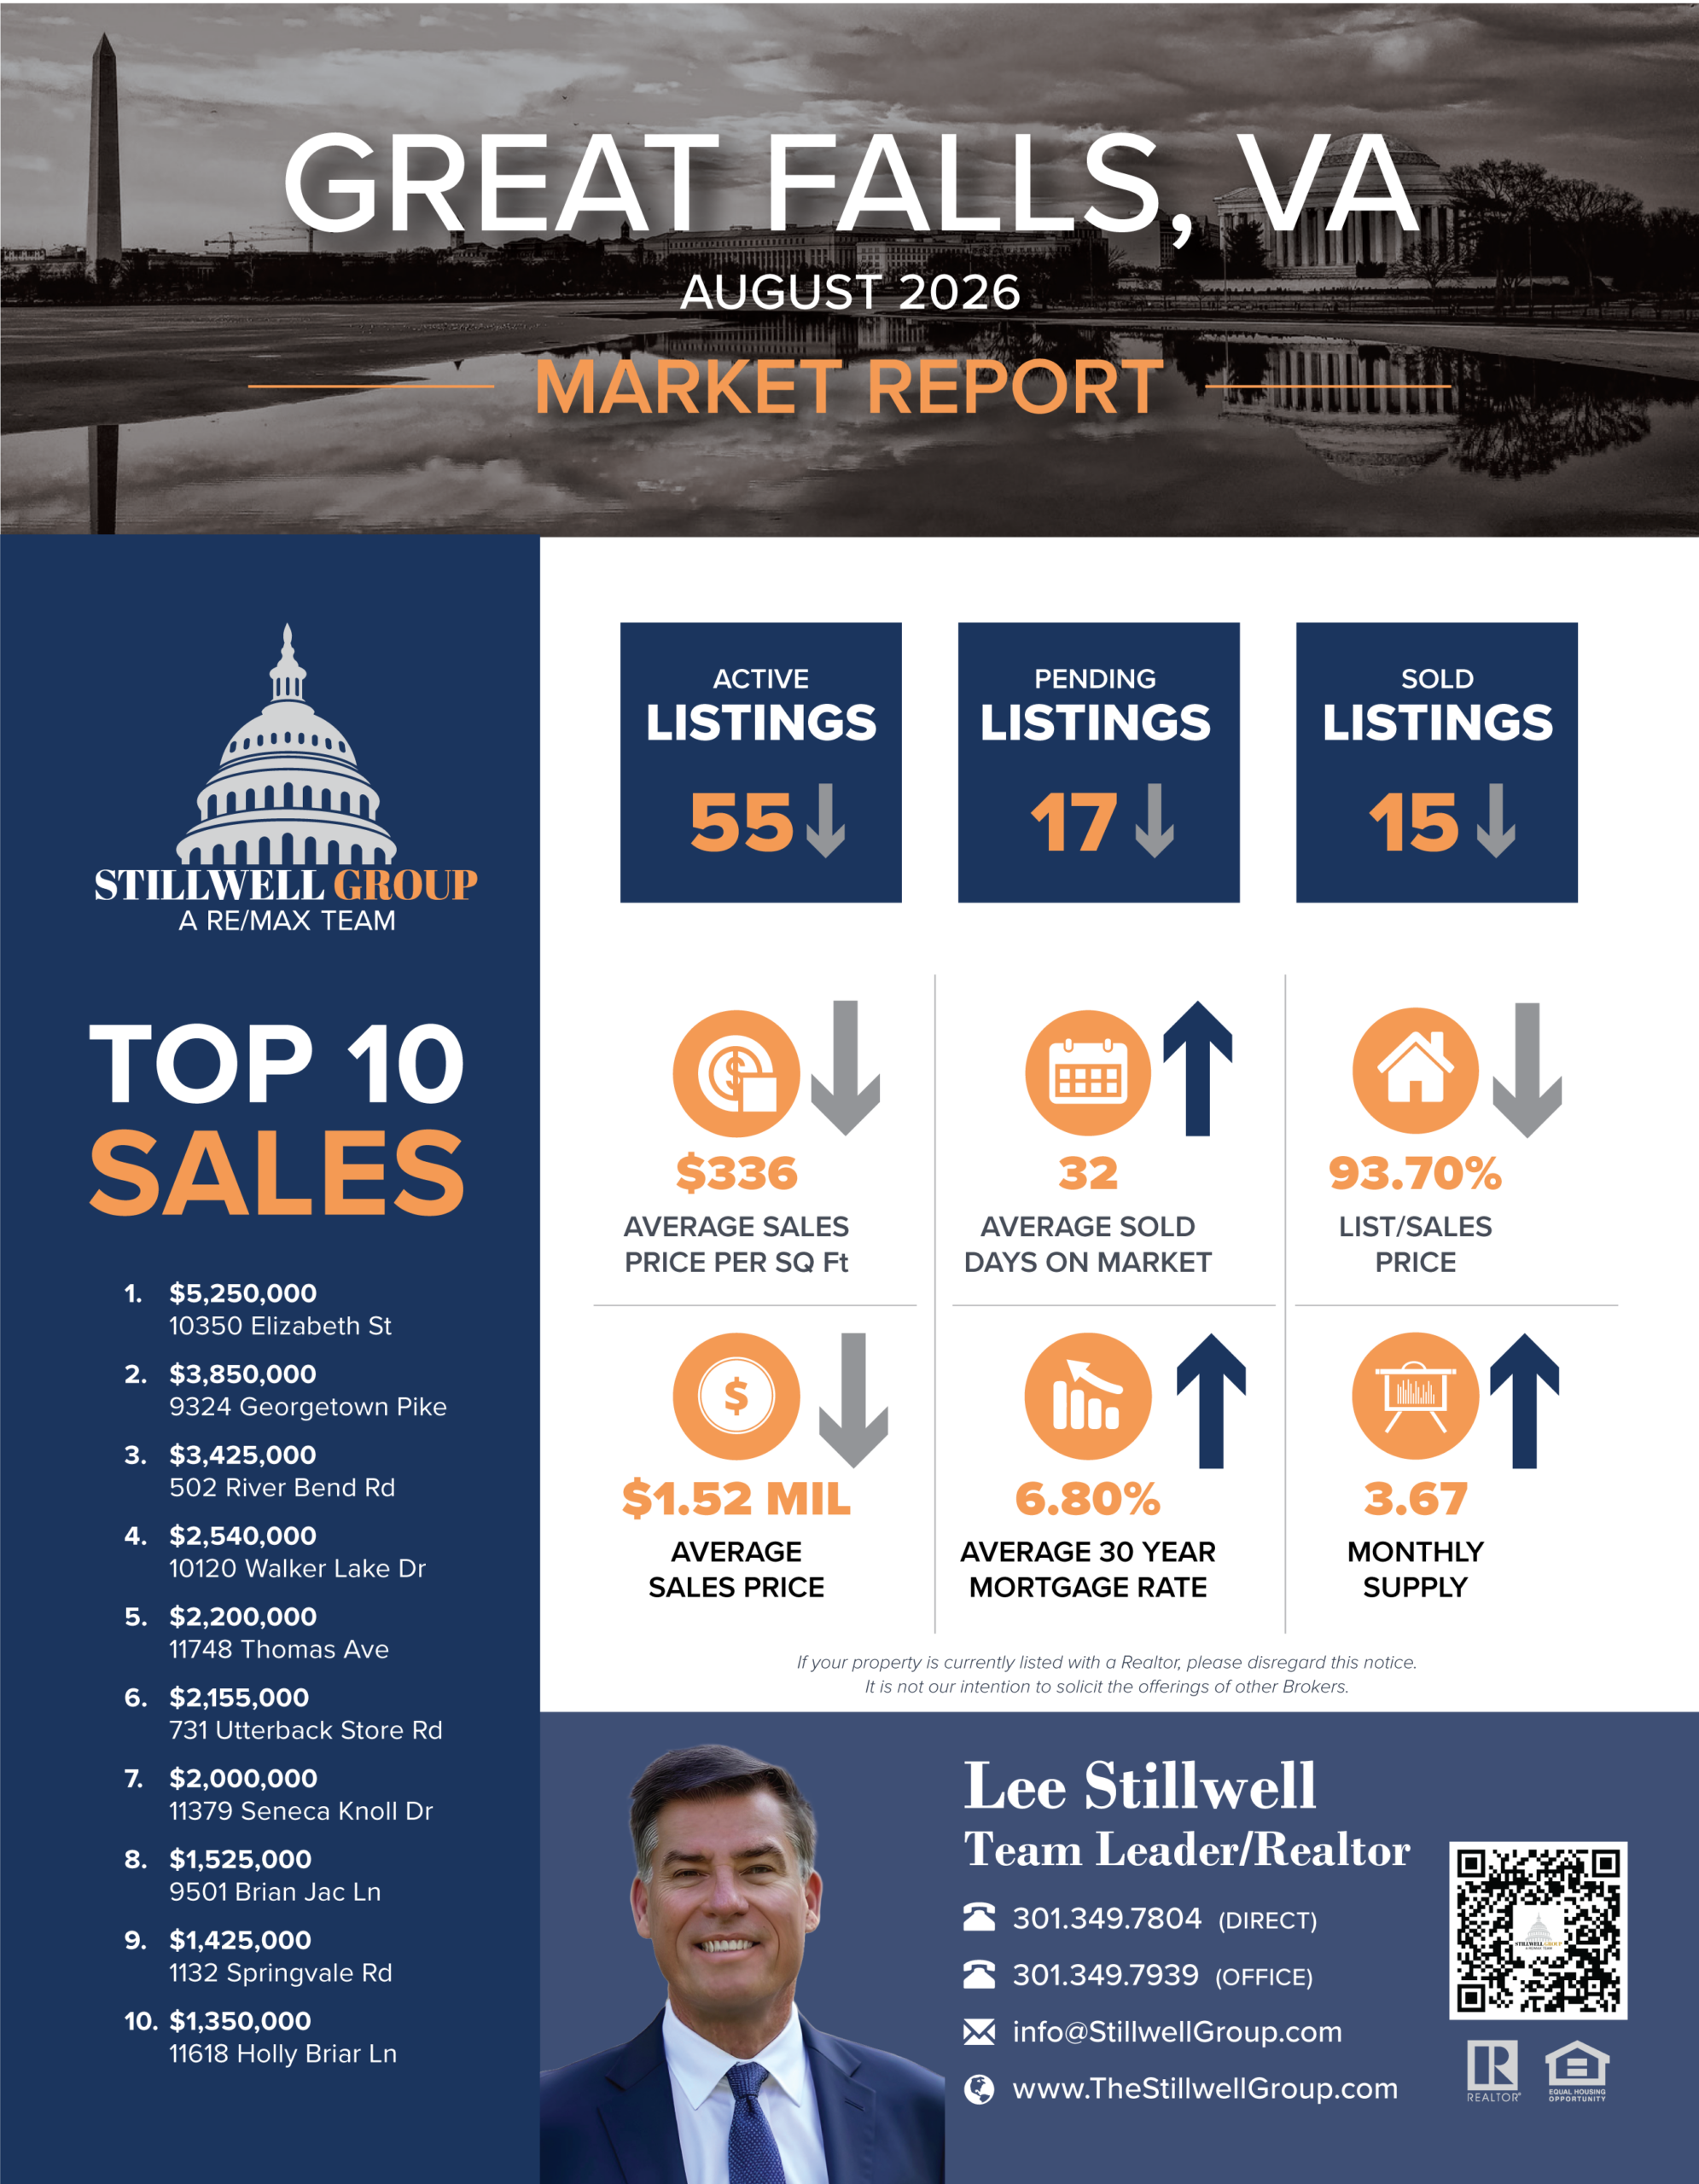
In Great Falls, VA, the median sold price for Detached properties for August was $1,525,000, representing a decrease of 21.4% compared to last month and a decrease of 10.3% from Aug 2025. The average days on market for units sold in August was 32 days, 22% above the 5-year August average of 26 days. There was a 15% month over month decrease in new contract activity with 17 New Pendings; a 5% MoM increase in All Pendings (new contracts + contracts carried over from July) to 21; and a 17.9% decrease in supply to 55 active units.
This activity resulted in a Contract Ratio of 0.38 pendings per active listing, up from 0.30 in July and an increase from 0.28 in August 2025. The Contract Ratio is 14% lower than the 5-year August average of 0.44. A higher Contract Ratio signifies a relative increase in contract activity compared to supply, and indicates the market is moving in the seller’s favor. A lower Contract Ratio signifies a relative decrease in contract activity compared to supply, and indicates the market is moving in the buyer’s favor.


